¶ Summary
- Cross-country dataset is required to support research on the relationship between urbanization, human development, and inequality. The dataset includes indicators like Urban Concentration Ratio, GDP, Gini index, and HDI that had to be sourced from multiple online sources: GeoNames, World Bank, and Wikidata. These sources overlap across 191 countries, but around 8% of country names do not match consistently, posing a record-linkage challenge.
- The task is to build a clean, merged dataset by resolving naming inconsistencies across databases and to evaluate multiple record-linkage algorithms. The goal is to identify an approach that balances accuracy with flexibility for different development environments (analytics, low-code, no-code), while ensuring reproducibility and transparency.
- Record-linkage algorithms are tested using country names, with ISO codes used for back-testing accuracy. The evaluation includes: KNIME’s Similarity Search for no-code workflows, Python’s difflib for analytical coding, and Elasticsearch for low-code implementation. Each algorithm is assessed on statistical performance, and results are scored to support human validation. Machine learning approaches are excluded to maintain interpretability.
- The evaluation identifies the best-performing technology, balancing accuracy and usability. The final dataset is generated using the selected method, ensuring a reliable foundation for subsequent research and reporting.
¶ Case applications and Context
This case may support a research like the ones detailed in these papers:
- https://www.researchgate.net/publication/354353499
How_does_urbanization_affect_the_human_development_index - A cross-country analysis - https://www.nature.com/articles/s42949-021-00040-y
Urbanization can help reduce income inequality - https://www.researchgate.net/publication/264637431
The Global Pattern of Urbanization and Economic Growth Evidence from the Last Three Decades - https://www.adruk.org/our-work/browse-all-projects/data-first
ADR UK: Harnessing the potential of linked administrative data for the justice system - other JEL O15 / O18 / R11 / R12 analyses
¶ Technical details
¶ expected output
We will generate the following country-level table:
| country name | population | Urban Concentration Ratio CR8 | Gini index | HDI | GDP USD | year |
|---|---|---|---|---|---|---|
| Afghanistan | 37,172,386 | 0.184 | 27.8 | 0.478 | 14,786,861,638 | 2021 |
| … | … | … | … | … | … | … |
| Zimbabwe | 14,439,018 | 0.267 | 50.3 | 0.593 | 28,371,238,666 | 2021 |
¶ input
The constituents of such table will be retrieved from these online databases:
- www.geonames.org - for the population of the cities of the world. Dataset published in CVS format. We will compute our own Urban Concentration Ratio by applying the CR8 formula - a common market concentration measure - to the population of the cities.
- data.worldbank.org - for the GDP - datasets published in CVS format.
- www.wikidata.org - for the Gini index and the HDI, which we will get through a SPARQL query.
The three online databases have 191 countries in common but 8% of the country names do not match (US and China included):
| www.geonames.org | data.worldbank.org | www.wikidata.org |
|---|---|---|
| Congo Republic | Congo, Rep. | Republic of the Congo |
| DR Congo | Congo, Dem. Rep. | Democratic Republic of the Congo |
| … | … | … |
¶ data model
The ISO codes of the countries are available in each dataset.
After performing name-matching, we will use the ISO codes available in each database for back-testing.
¶ evaluated technologies
We will test several algorithms for a record-linkage based on country names. We will explore these technologies:
| platform | approach | target user profiles | platform component | component customizability |
|---|---|---|---|---|
| KNIME | no-code | business users | Similarity Search | yes |
| python | full-code | software developers | difflib | no |
| Elasticsearch | low-code | analysts + architects | analyzer + tokenizer | yes |
¶ implementation choices and goals
In this project we have two goals:
• the quality and the trustability of the output i.e. the final report
• the fairness of the benchmarking
we want to choose the solution (= software + approach) that best enables the first goal - in this and in future occasions. For that, all the test will have to be executed with the same input and the same assumptions.
¶ Execution
¶ Data capture - side notes
Below is the SPARQL query to extract the relevant data from Wikidata.
There may be multiple records for each country due to multiple capitals (as for South Africa), multiple HDI, multiple Gini. For this exercise, in case of such multiple attributes, we will take a random one by using the SAMPLE aggregating function.
# API: https://query.wikidata.org/?query=
# problem: there may be duplicates, due to multiple capitals, multiple HDI, multiple Gini.
# solution: SAMPLE
# alt: SELECT ?countryId ?countryLabel ?ISO2 ?ISO3 (SAMPLE(?capitalLabel) AS ?capitalLabel_) (SAMPLE(?capitalId) AS ?capitalId_)  (SAMPLE(?HDI) AS ?HDI_) (SAMPLE(?Gini) AS ?Gini_)

SELECT ?countryLabel ?ISO2 ?ISO3 (sample(?labelOfCapital) as ?Capital_) (SAMPLE(?HDI) AS ?HDI_) (SAMPLE(?Gini) AS ?Gini_)
WHERE
{
  ?country wdt:P31 wd:Q3624078 .
  #...sovereign state
  #not a former country...
  #FILTER NOT EXISTS {?country wdt:P31 wd:Q3024240}
  #and no an ancient civilisation (needed to exclude ancient Egypt)...
  #FILTER NOT EXISTS {?country wdt:P31 wd:Q28171280}
  #not required as long as you demand an ISO
  OPTIONAL { ?country wdt:P36 ?capital } .
  OPTIONAL { ?country wdt:P1081 ?HDI } .
  OPTIONAL { ?country wdt:P1125 ?Gini } .
  { ?country wdt:P297 ?ISO2 } .
  { ?country wdt:P298 ?ISO3 } .
  #
  OPTIONAL {?capital rdfs:label ?labelOfCapital}

  SERVICE wikibase:label { bd:serviceParam wikibase:language "en" }
}
#GROUP BY  ?countryId ?countryLabel ?ISO2 ?ISO3
GROUP BY  ?countryLabel ?ISO2 ?ISO3
ORDER BY ?countryLabel
OFFSET 0
LIMIT 1000
# ... 196 results, Apr-2023
¶ python 3: difflib
The behavior of this library is symmetrical and can be used in this way:
def string_similarity(str1, str2):
    result =  difflib.SequenceMatcher(a=str1, b=str2)
    rt = result.ratio()
    assert rt >= 0.0 and rt <= 1.0
    return rt
We will use a matching process that computes the score for each pair and will start an iterative withdraw, picking the best match at each step, as below:
# dfL = left table # dfR = right table # left_src = left table tag # right_src = right table tag

# initializing the matrix
out_of_scale_init_val = -3.14 # no score will ever have this value, so: max(score,out_of_scale_init_val) = score, always.
dfscores = pd.DataFrame(out_of_scale_init_val, index = dfL.index.values, columns = dfR.index.values)

for colR in dfscores.columns:
    for rowL in dfscores.index.values:
            dfscores.at[rowL, colR] = string_similarity(rowL,colR)
            # we do not make assumptions on the symmetry

#finding and popping the best at each step:
for i in range(min(dfscores.shape)):
    cols_bests = dfscores.max()
    abs_best = max(cols_bests)
    col_of_best = cols_bests.idxmax()
    row_of_best = dfscores[col_of_best].idxmax()
    output_new_match({'left_src',left_src, 'left':row_of_best, 'right_src',right_src, 'right':col_of_best, 'score': round(abs_best,4)})
  # eg {'left_src':'wb', 'left':,"Turkiye", 'right_src':'gn','right':"Turkey", 'score':0.7692}
    dfscores.drop(col_of_best,inplace=True,axis=1)
    dfscores.drop(row_of_best,inplace=True,axis=0)
Confusion matrix and other performance metrics for this matching:
wb-vs-gn, cn only: TP 205 TN 37 FP 6 FN 4 TPR 0.981 FNR 0.019 TNR 0.86 FPR 0.14 accuracy 0.96 precision 0.972 recall 0.981 F1-score 0.976
wd-vs-gn, cn only: TP 191 TN 54 FP 4 FN 3 TPR 0.985 FNR 0.015 TNR 0.931 FPR 0.069 accuracy 0.972 precision 0.979 recall 0.985 F1-score 0.982
wb-vs-wd, cn only: TP 181 TN 13 FP 14 FN 3 TPR 0.984 FNR 0.016 TNR 0.481 FPR 0.519 accuracy 0.919 precision 0.928 recall 0.984 F1-score 0.955

wb-vs-gn, cn+cap: TP 211 TN 41 FP 0 FN 0 TPR 1.0 FNR 0.0 TNR 1.0 FPR 0.0 accuracy 1.0 precision 1.0 recall 1.0 F1-score 1.0
wd-vs-gn, cn+cap: TP 195 TN 57 FP 0 FN 0 TPR 1.0 FNR 0.0 TNR 1.0 FPR 0.0 accuracy 1.0 precision 1.0 recall 1.0 F1-score 1.0
wb-vs-wd, cn+cap: TP 191 TN 16 FP 4 FN 0 TPR 1.0 FNR 0.0 TNR 0.8 FPR 0.2 accuracy 0.981 precision 0.979 recall 1.0 F1-score 0.99

NB
wb-vs-gn = matching world bank names (wb) with geonames names (gn) / wikidata (wd)
cn only = matching based on country names only
cn+cap  = matching based on country names + capital names
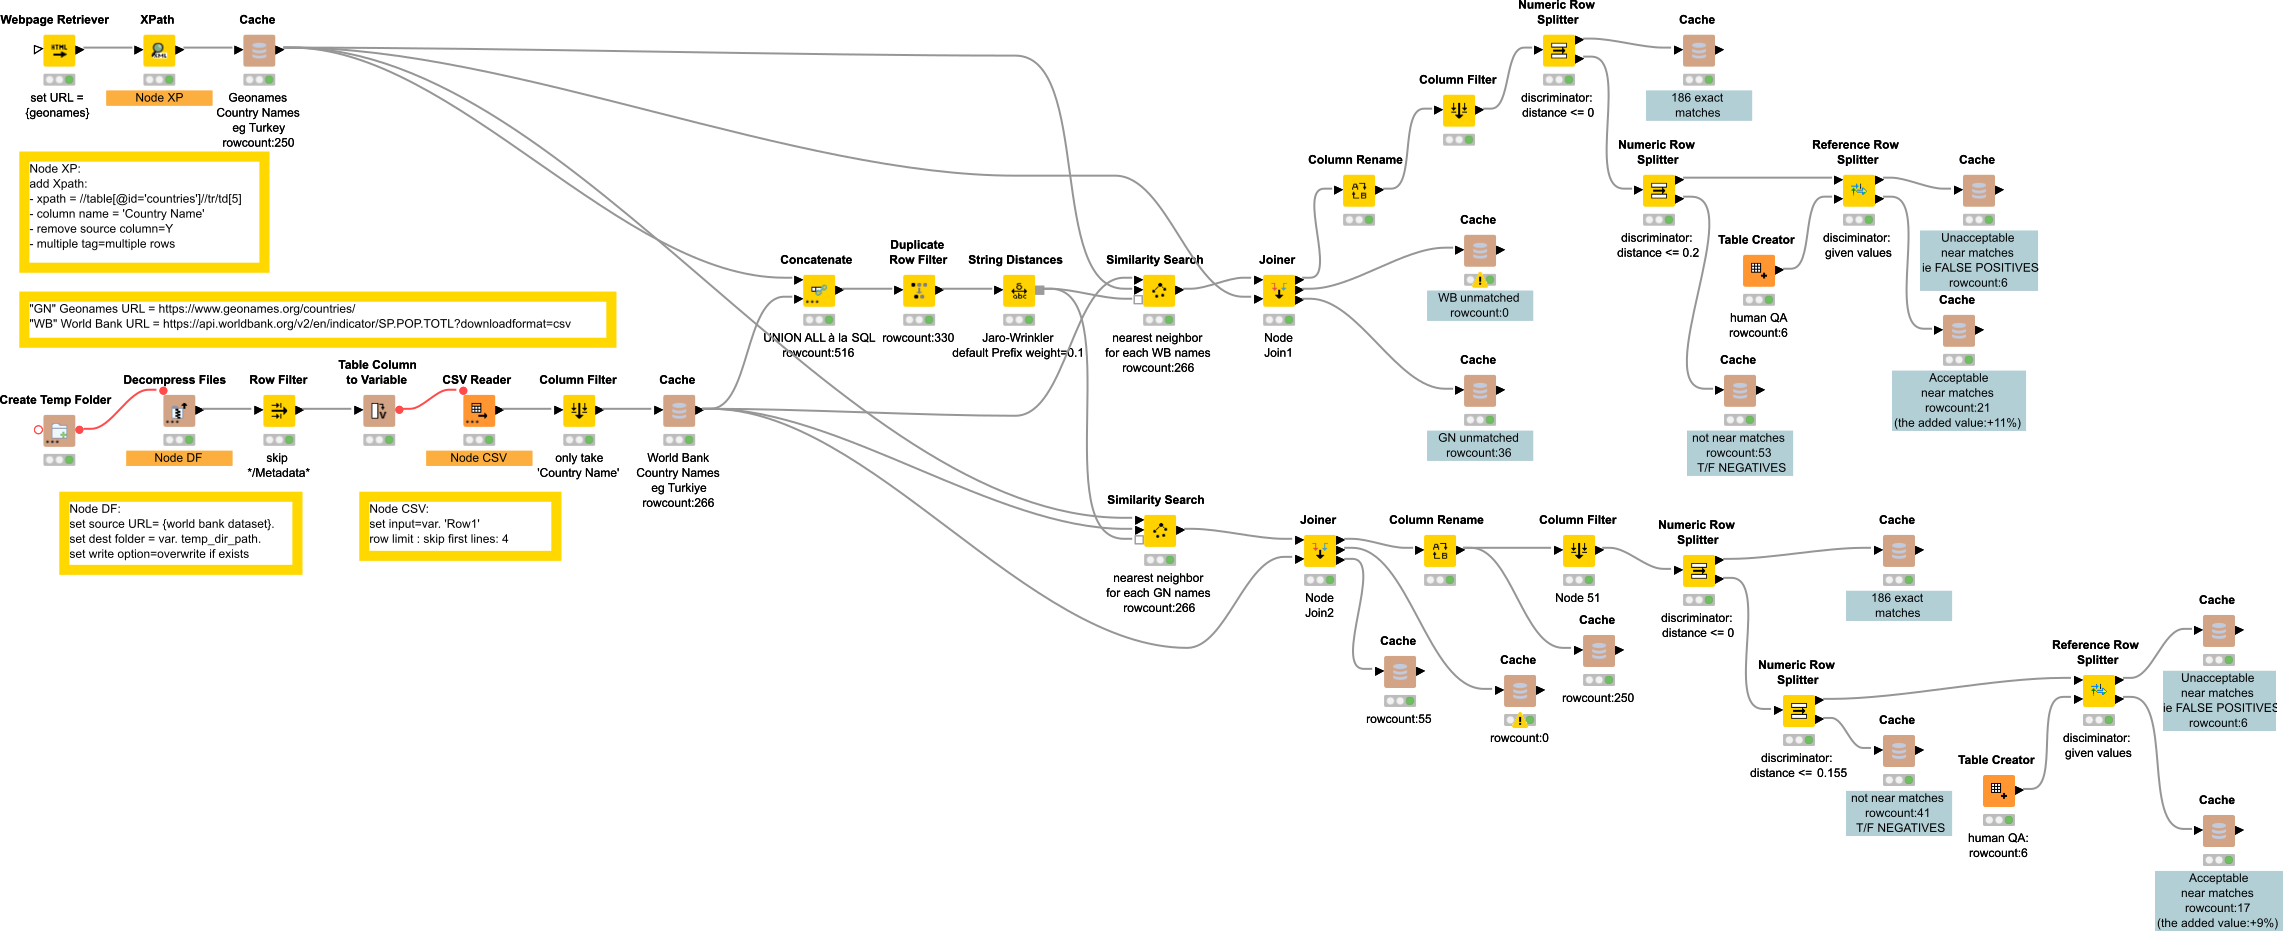
¶ KNIME 4: Similarity Search
The String Distance task implemented in KNIME 4.6 creates a matrix,
and the Similarity Search task runs the Jaro-Wrinkler's algorithm to compute the string distances with prefix weighting on the matrix.
Other algorithms are also available.

The above workflow is integrated in a complete workflow as in this picture.
Confusion matrix and other performance metrics for this matching:
wb-vs-gn, cn only: TP 201 TN 0 FP 51 FN 10 TPR 0.953 FNR 0.047 TNR 0.0 FPR 1.0 accuracy 0.767 precision 0.798 recall 0.953 F1-score 0.868
wd-vs-gn, cn only: TP 188 TN 0 FP 64 FN 6 TPR 0.969 FNR 0.031 TNR 0.0 FPR 1.0 accuracy 0.729 precision 0.746 recall 0.969 F1-score 0.843
wb-vs-wd, cn only: TP 176 TN 18 FP 19 FN 12 TPR 0.936 FNR 0.064 TNR 0.486 FPR 0.514 accuracy 0.862 precision 0.903 recall 0.936 F1-score 0.919

wb-vs-gn, cn+cap: TP 201 TN 0 FP 51 FN 10 TPR 0.953 FNR 0.047 TNR 0.0 FPR 1.0 accuracy 0.767 precision 0.798 recall 0.953 F1-score 0.868
wd-vs-gn, cn+cap: TP 188 TN 0 FP 64 FN 6 TPR 0.969 FNR 0.031 TNR 0.0 FPR 1.0 accuracy 0.729 precision 0.746 recall 0.969 F1-score 0.843
wb-vs-wd, cn+cap: TP 176 TN 18 FP 19 FN 12 TPR 0.936 FNR 0.064 TNR 0.486 FPR 0.514 accuracy 0.862 precision 0.903 recall 0.936 F1-score 0.919

NB
wb-vs-gn = matching world bank names (wb) with geonames names (gn) / wikidata (wd)
cn only = matching based on country names only
cn+cap  = matching based on country names + capital names
¶ Elasticsearch:
The elasticsearch instance tested:
# docker
image: "elasticsearch:5.3.2"
The index creation command:
{
    "settings": {
        "analysis": {
            "analyzer": {
                "custom_analyzer1_nGram": {
                    "tokenizer": "custom_tokenizer1_nGram",
                    "filter": [ "lowercase", "asciifolding"	]
                }
            },
            "tokenizer": {
                "custom_tokenizer1_nGram": {
                    "type": "ngram", "min_gram": 1,	"max_gram": 15,
                    "token_chars": [ "letter", "digit",	"punctuation", "symbol"	]
                }
            }
        }
    },
    "mappings": {
        "cnmatchmapping": {
            "properties": {
                "cn": {	"type": "text",		"copy_to": "allfields"	},
                "capt": {	"type": "text",	"copy_to": "allfields"	},
                "src": { "type": "keyword" },
                "allfields": { "type": "text", "analyzer": "custom_analyzer1_nGram"	}
            }
        }
    }
}
An example of a search command used:
{
    "size": 1,
    "query": {
        "bool": {
            "should": [
                { "match": { "cn": {	"query": "country name X", "boost": 1, "fuzziness": "AUTO" }}},
                { "match": { "capt": { "query": "capital name Y or NIL", "boost": 2, "fuzziness": "AUTO" }}}
            ],
            "minimum_should_match": 2,
            "filter": {	"term": {	"src": "dataset tag TT" }
            }
        }
    },
    "sort": [ "_score" ]
}
The matching candidate is removed after it gets paired.
Confusion matrix and other performance metrics for this matching:
gn-vs-wb, cn only: TP 138 TN 112 FP 1 FN 1 TPR 0.993 FNR 0.007 TNR 0.991 FPR 0.009 accuracy 0.992 precision 0.993 recall 0.993 F1-score 0.993
gn-vs-wb, cn only: TP 195 TN 57 FP 0 FN 0 TPR 1.0 FNR 0.0 TNR 1.0 FPR 0.0 accuracy 1.0 precision 1.0 recall 1.0 F1-score 1.0
wb-vs-wd, cn only: TP 136 TN 71 FP 2 FN 2 TPR 0.986 FNR 0.014 TNR 0.973 FPR 0.027 accuracy 0.981 precision 0.986 recall 0.986 F1-score 0.986

wb-vs-wd, cn+cap: TP 180 TN 29 FP 1 FN 1 TPR 0.994 FNR 0.006 TNR 0.967 FPR 0.033 accuracy 0.991 precision 0.994 recall 0.994 F1-score 0.994
wd-vs-gn, cn+cap: TP 126 TN 69 FP 0 FN 0 TPR 1.0 FNR 0.0 TNR 1.0 FPR 0.0 accuracy 1.0 precision 1.0 recall 1.0 F1-score 1.0
wd-vs-gn, cn+cap: TP 183 TN 12 FP 0 FN 0 TPR 1.0 FNR 0.0 TNR 1.0 FPR 0.0 accuracy 1.0 precision 1.0 recall 1.0 F1-score 1.0

NB
wb-vs-gn = matching world bank names (wb) with geonames names (gn) / wikidata (wd)
cn only = matching based on country names only
cn+cap  = matching based on country names + capital names
¶ Wrap-up: CR8 index calculation and mash-up
For our objective, we can accept FN (unmatched items) and we want to avoid having FP (mismatched items) because we are happy to manually match unmatched items but we don't want to verify the matches done.
In terms of country-names matching performance, with respect to how we have integrated and configured the shortlisted implementations, it is worth noting that the test done with Elasticsearch has had zero false negatives and zero false positives even without resorting to additional contextual data (i.e., the names of the capitals).
Summary of the approaches:
| technology | strategy | data |
|---|---|---|
| KNIME | native many-to-many routine, closed-box | countrynames, no capitals |
| python difflib | one-to-one routine, no-replacement | countrynames, no capitals |
| elasticsearch fuzzy | one-to-one routine, no-replacement | countrynames, no capitals |
The Excel performance metrics table is available here
After getting the paired country names, what is left to do to compose the final report is the just computation of the CR8 ratios and the joining of all our datasets.
Below is the analytical code based on python pandas that, given the Geonames datasets with all the cities of the world with a population of 1000+ and the total population of each country, will compute the CR8 ratio as: sum of the populations of the 8 most populated cities of each country / total population
# cr8.py
import pandas as pd
in_csv_filename=r".\geonames-all-cities-with-a-population-1000-and-above.csv"

class ConcentrRatio:
    def __init__(self, dataframe):
        self.df = dataframe
    def groupedBy(self,groupcol,valuecol):
        self.dfsubtotAll = self.df.groupby(groupcol).agg(sum_all=(valuecol,sum),count_all=(valuecol,'count'))
        self.groupcol,self.valuecol = [groupcol,valuecol]
        return self
    def excludedIfSizeBelow(self,min_group_size):
        self.dfsubtotSignif = self.dfsubtotAll.query('count_all >= @min_group_size')
        self.df = self.df.join(other=self.dfsubtotSignif,how='inner',on=self.groupcol)
        self.min_group_size = min_group_size
        return self
    def withValuesRankedByGroup(self):
        self.df['rank'] = self.df.groupby([self.groupcol])[self.valuecol].rank(ascending=False,method='dense')
        self.df = self.df.query('rank <= @self.min_group_size')
        return self
    def getSubtotals(self):
        self.dftop = self.df.groupby(self.groupcol).agg(sum_topn=(self.valuecol,'sum'))
        return self
    def getDFwithRatio(self):
        dfj = self.dfsubtotAll.join(other=self.dftop) # left outer
        dfj['CR8'] = round(dfj['sum_topn'] / dfj['sum_all'],3)
        return dfj

df=pd.read_csv(in_csv_filename) #,skiprows=0,encoding='utf-8'
cr = ConcentrRatio(df).groupedBy('Country name EN','Population').excludedIfSizeBelow(8).withValuesRankedByGroup().getSubtotals()
cr.getDFwithRatio().to_csv(in_csv_filename+'.out.csv')
equivalent in SQL for MS SQL Server:
-- tested on SQL Server 2016 13.0
-- based on table cnct(cn,ct,pop) e.g. Italy,Rome,2873000
DECLARE @minctn INT, @maxctn INT;
SET @minctn = 8;
SET @maxctn = 8;

WITH
CTE_only_cn_with_many_ct AS (
    SELECT cn FROM cnct GROUP BY cn HAVING count(*) >= @minctn
),
CTE_only_cn_with_many_ct_ranked AS (
    SELECT cn, ct, pop, ROW_NUMBER() /*not:DENSE_RANK()*/
  OVER ( PARTITION BY cn ORDER BY pop DESC) rank_no
    FROM cnct
    WHERE cn in (SELECT cn FROM CTE_only_cn_with_many_ct)
)
SELECT cn,sum(pop) AS sumtoppop
FROM CTE_only_cn_with_many_ct_ranked
WHERE rank_no <= @maxctn
GROUP BY cn
ORDER BY cn
¶ Appendix
¶ final report visualization
The final Excel data report is available here
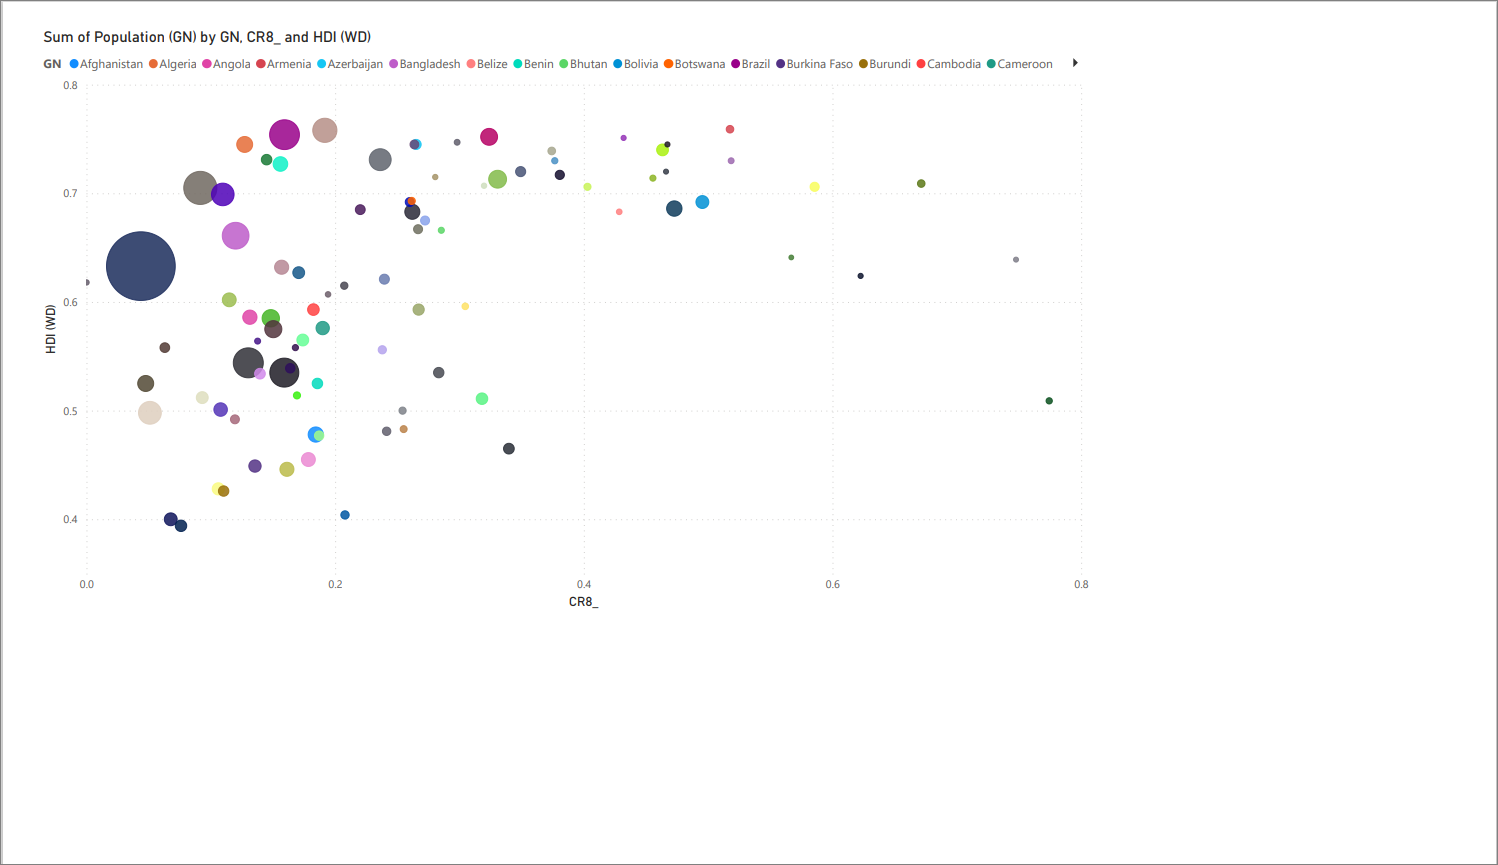
Bubble chart: CR8 vs. HDI (via PowerBI)
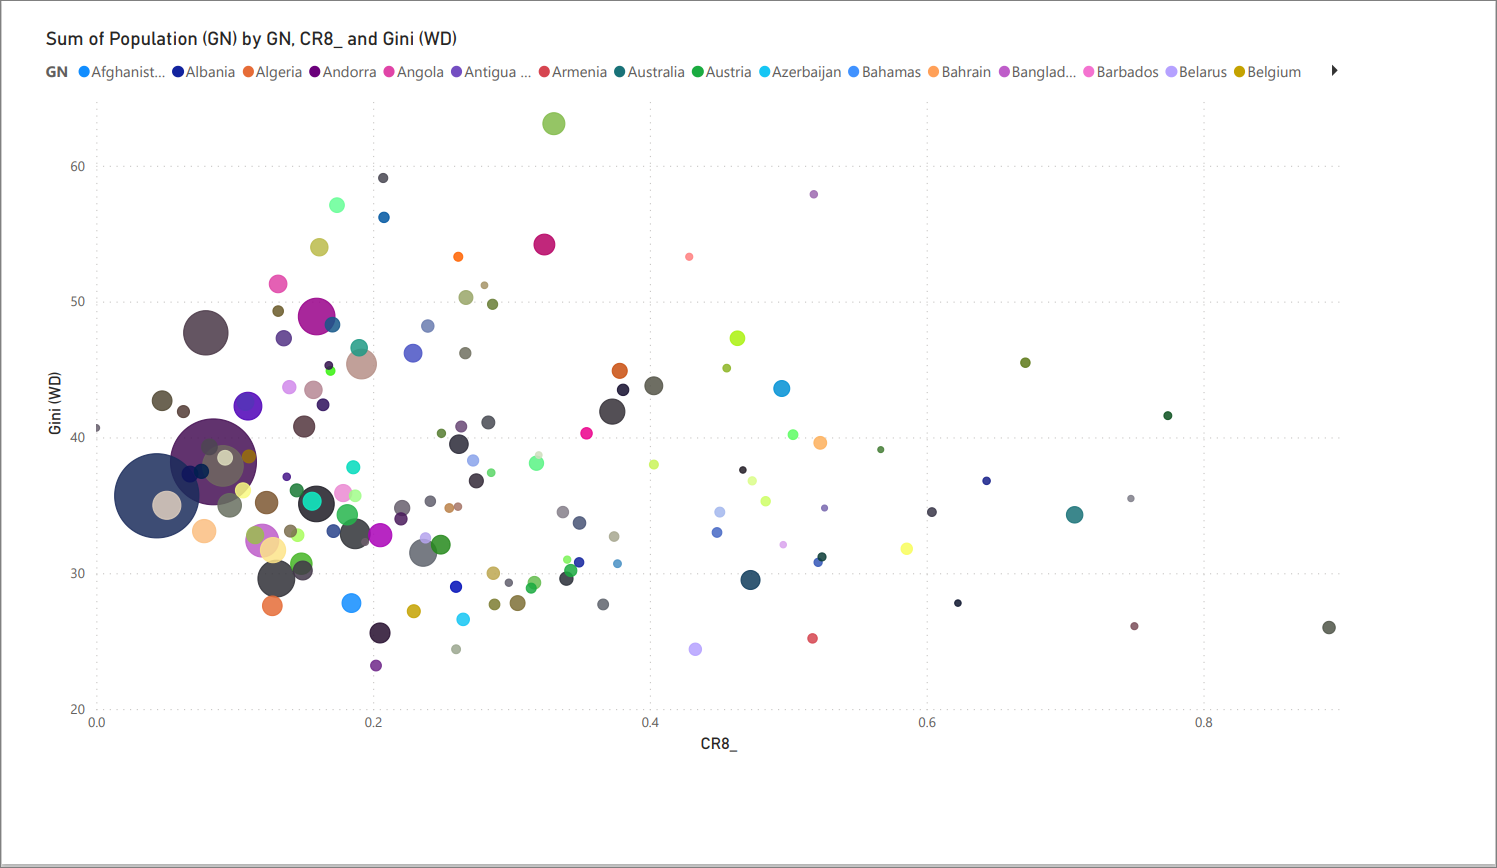
Bubble chart: CR8 vs. Gini (via PowerBI)
full-dataset correlation heatmap
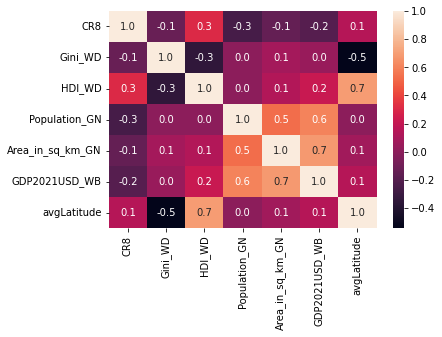
¶ comments
the highest correlations seem to occur between:
- HDI vs. Latitude
- Area vs. GDP
¶ recap on the technology used
- Python difflib
- KNIME String Similarity
- Elasticsearch
- MS SQL
- Python pandas
- PowerBI
¶ see also
- Splink: MoJ’s open source library for probabilistic record linkage at scale
- https://recordlinkage.readthedocs.io/en/latest/
- https://www.kaggle.com/code/mikeyhogarth/record-linkage-tutorial
back to Portfolio
